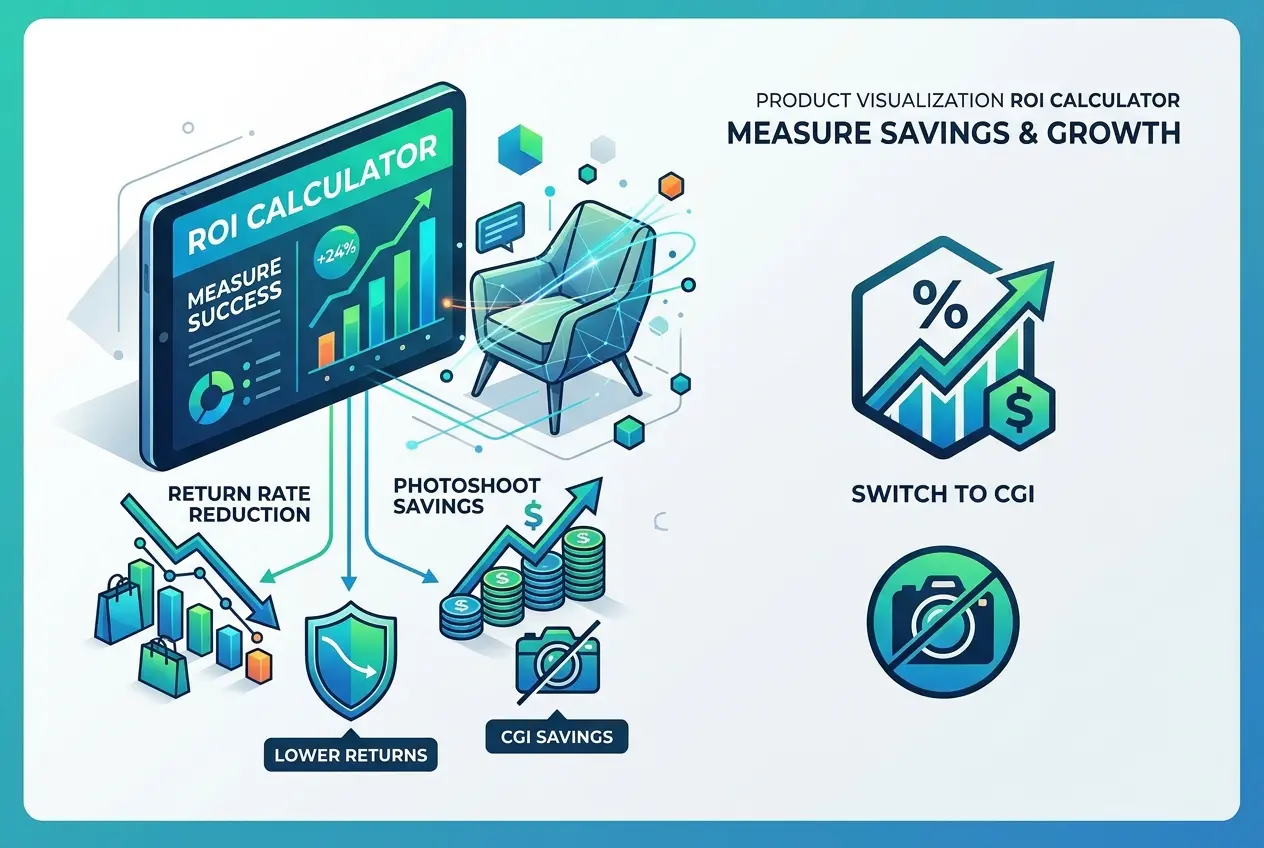
Most brands can tell you what their last photoshoot cost down to the rupee or dollar. Far fewer can tell you what it actually returned. That gap is why the conversation about CGI usually stalls at “it looks good, but is it worth it?” This post walks through a practical framework for answering that question, a Product Visualization ROI Calculator: How to Measure Return Rate Reduction and Photoshoot Savings After Switching to CGI, built from the cost lines and metrics you already have.
We’re a rendering studio, so we have a bias. But we’ve also watched enough clients run the numbers, sometimes with results that told them to keep a portion of their photography. The calculator below is honest about both outcomes. You’ll need your photoshoot invoices, your return data, and about an hour.
Why a Simple “Render vs. Photo” Price Comparison Misleads You
The first mistake is comparing one render’s price against one photograph’s price. A photograph is not a line item; it’s the end of a chain of costs that most invoices hide. Samples have to be manufactured and shipped. Someone has to steam, style, or clean them. Studios charge for the day, the crew, the retoucher, and the reshoot when a colorway arrives late. When a product changes, the whole chain restarts.
CGI has a different cost shape. The up-front cost is modeling and material development, and once the digital asset exists, new angles, colors, backgrounds, and seasonal scenes are comparatively cheap. So the correct comparison is total cost of ownership across the product’s life, not the price of a single image.
Building the Photoshoot Savings Side of the Calculator
Start by listing every cost you incur to get a finished image of one SKU. Be ruthless. Here is the structure we hand to clients:
| Cost Category | Photography | CGI |
|---|---|---|
| Sample production and shipping | Every SKU, every reshoot | Usually none; CAD or reference only |
| Studio, crew, stylist, location | Per shoot day | None |
| Retouching | Per image | Included in post-production |
| Modeling and material setup | None | One-time per product |
| New colorway or variant | Often a new shoot | Material swap on existing model |
| New angle or lifestyle scene | Reshoot | Re-render |
| Internal coordination time | Significant | Mostly review rounds |
The formula itself is simple:
Photography cost per SKU over its lifespan = initial shoot + (number of reshoots × reshoot cost) + sample and logistics costs + internal time.
CGI cost per SKU over its lifespan = modeling and look development + per-image render cost × images needed + revision rounds.
Run it for the whole catalog, not one hero product. The savings tend to appear in the variants. A product with twelve finishes costs twelve setups in a studio but one model and twelve material assignments in CGI. If your catalog is mostly single-variant items with a one-off launch image, the gap narrows, and that’s worth knowing before you commit.
Don’t forget the time-to-market line
Photography needs a physical sample. CGI can start from engineering files, which means images can exist before the first production run. If a delayed listing costs you a selling season or a pre-order window, that’s real money. Put an estimate on it, label it as an estimate, and keep it separate from the hard-cost savings so nobody accuses your spreadsheet of wishful thinking.
Measuring Return Rate Reduction Without Fooling Yourself

This is the harder half, and the one clients most often get wrong. Returns fall for many reasons, so attributing a change to imagery requires discipline.
First, pull the return reasons, not just the return count. Most platforms and returns portals record a reason code. The ones relevant to visualization are “item not as described,” “color different from picture,” “wrong size or scale,” and “looks different than expected.” Returns for defects, shipping damage, or change of mind aren’t going to move with better images, so exclude them from your baseline.
Second, record a baseline over a stable period before the switch. Make sure you’re comparing similar seasons, because returns shift with holidays and promotions.
Third, where you can, test rather than assume. Swap CGI imagery into a subset of listings while keeping a comparable set on the old photography, then compare the image-related return reasons between the groups. It’s not a laboratory experiment, but it’s far more convincing than a before-and-after across the whole catalog.
The return-side formula:
Annual savings = (image-related returns avoided) × (cost per return)
Cost per return is more than the refund. Add outbound and return shipping, inspection and restocking labor, the markdown on items that can’t be resold as new, and payment processing fees you don’t get back. Customer service time belongs there too. Many sellers undercount this and then wonder why returns feel expensive.
Why CGI Can Reduce Image-Related Returns (and When It Doesn’t)
It helps to understand the mechanism, because it tells you where to expect results. Returns tied to expectations happen when the picture promises something the product doesn’t deliver. CGI helps in a few specific ways.
Color consistency is one. A physical photograph passes through lighting, camera profile, and a retoucher’s monitor. A CGI material is built from measured or matched values and rendered under controlled, neutral lighting, so the same finish looks the same across every angle and every listing. Scale is another: because the scene is built to real dimensions, you can place the product next to familiar objects or in a room with correct proportions, which reduces the “it’s smaller than I thought” return. Detail is the third. You can show cutaways, internal mechanisms, and close-ups of texture that would be awkward to shoot.
Here’s the catch we always tell clients. CGI helps only if the render is accurate. A glossy, over-polished image that exaggerates the product will raise returns, not lower them. In our studio, we push clients to supply physical material swatches or reference samples so that fabric weave, grain direction, and sheen are matched rather than guessed. That’s a reason to hire a studio that does material matching properly, not just good lighting. Our product rendering services are built around that kind of fidelity.
Putting the Full Product Visualization ROI Calculator Together

Now combine both sides over a defined period, typically twelve months, plus the amortized setup:
Total benefit = photoshoot savings + return savings + estimated revenue effect (optional, shown separately)
Total cost = modeling and look development + per-image rendering + revisions + any internal time spent on review
ROI = (total benefit − total cost) ÷ total cost
A few practical rules for using it without deceiving yourself:
- Use your own invoices and return data. Industry averages are no substitute.
- Amortize modeling across the product’s real selling life, and across every use of the model: web, ads, catalogs, packaging, AR.
- Keep hard savings and projected revenue gains in separate rows.
- Recalculate after one quarter with real data and replace your assumptions.
What Clients Get Wrong
After many of these conversations, the same mistakes keep appearing.
They count only the first image. The value of a 3D model is that it keeps producing. If you only price the first render, CGI looks expensive and you miss the variants, the seasonal scenes, and the ad creatives that come nearly free later.
They skip the reference material. Sending only a CAD file and expecting the render to match a physical finish leads to revision rounds, which cost time and money. Provide swatches, a physical sample to photograph for reference, or at least clear material specs.
They attribute every return change to imagery. A price drop, a new supplier, or a packaging change can all move return rates. Isolate image-related reasons or test on a subset.
They go all-or-nothing. Some products still photograph better than they render, such as items where human interaction, draping fabric, or food-like organic textures are the selling point. A hybrid approach, CGI for the hard-surface and variant-heavy catalog and photography where it genuinely wins, is often the highest-ROI answer. Where CGI fits best, such as furniture, lighting, appliances, and electronics, our 3D product animation services can also extend the same model into motion content without starting over.
Ready to Run Your Own Numbers?
Treat the calculator as a living document rather than a one-time justification. Start with a pilot on a handful of SKUs, record the costs and the image-related return reasons honestly, and let the data decide how far to go. If you’d like help scoping that pilot, estimating modeling effort for your catalog, or sanity-checking your spreadsheet, get in touch with our team and send us a few product references. We’ll tell you plainly where CGI will save you money and where it won’t.
Frequently Asked Questions
How do I calculate ROI when switching from traditional photography to CGI product visualization?
Start by totaling your annual photography costs (studio rental, photographer, stylists, sample shipping, retouching, and reshoots), then subtract your projected CGI costs (modeling, rendering, software, and any outsourcing fees). Add the revenue gained from reduced returns and faster time-to-market, then divide the net gain by your total CGI investment and multiply by 100. Most brands should include a 12-month window, since upfront 3D asset creation costs are amortized as the same models are reused across channels.
How can I measure return rate reduction after switching to CGI product images?
Establish a baseline by recording your return rate, especially returns coded as 'item not as described' or 'looks different than pictured,' for 3-6 months before the switch. After launching CGI imagery, track the same SKUs over a comparable period and compare, ideally using an A/B test where some customers see photos and others see CGI. Multiply the drop in returns by your average cost per return (shipping, handling, restocking, and lost inventory value) to get your dollar savings.
How much can brands realistically save on photoshoots by using CGI instead?
Savings typically range from 30% to 60% overall, and they grow as your catalog expands because 3D models can be reused for new colors, angles, lifestyle scenes, and seasonal campaigns without new shoots. The biggest savings come from eliminating sample shipping, studio and crew fees, and reshoots for product updates. Brands with a small catalog of simple products may see a slower payback, while those with many variants or large furniture and appliances usually see the fastest ROI.
What costs should I include in a CGI product visualization ROI calculator?
Include one-time costs such as 3D modeling, material and texture creation, and pipeline setup, along with recurring costs like rendering, software licenses, asset storage, and revisions. On the savings side, account for avoided photography expenses, reduced returns, lower logistics costs, and faster launch times. Don't forget indirect benefits like higher conversion rates from interactive 3D or AR features, which can significantly improve your payback.
How long does it take to break even after switching to CGI for product visualization?
Most ecommerce brands reach break-even within 6 to 18 months, depending on catalog size, product complexity, and how often they update their imagery. Upfront modeling is the largest expense, but the cost per additional image drops sharply once models exist. To estimate your timeline, divide your total CGI setup cost by your monthly savings from reduced photoshoots and fewer returns.